A quick blog post for maps I am creating as Hurricane Sandy approaches New Jersey. The background imagery for these maps is from ESRI’s National Geographic Basemap. The weather information is rom NOAA’s nowCOAST Info Depot. I am also creating maps of power outages by municipality for Monmouth County.
I will be continually updating this post throughout the week (after getting power back at my home in Eatontown, NJ). Most recent images at the top of the post, scroll down for older images.
– Power Outage Maps –

Updated power outage map for Monmouth County as of Friday evening at 11:30pm.

Early afternoon (11/01/2012) update on power outages in Monmouth County. The shows the percentages for Jersey Central Power & Light who are without power. I believe these percentages can be extrapolated to everyone, regardless of which power company they use.

This morning’s (11/01/2012) update on power outages in Monmouth County. The shows the percentages for Jersey Central Power & Light who are without power. I believe these percentages can be extrapolated to everyone, regardless of which power company they use.

A map of power outages for municipalities in Monmouth County. It shows the percentages for Jersey Central Power & Light who are without power. While the map only shows JCPL customers, I imagine these percentages can be extrapolated to everyone, regardless of which power company they use. We have JCPL in Eatontown and have power. As an idea of how lucky we are, only 1122 customers out of 6,944 (16%) currently have power.
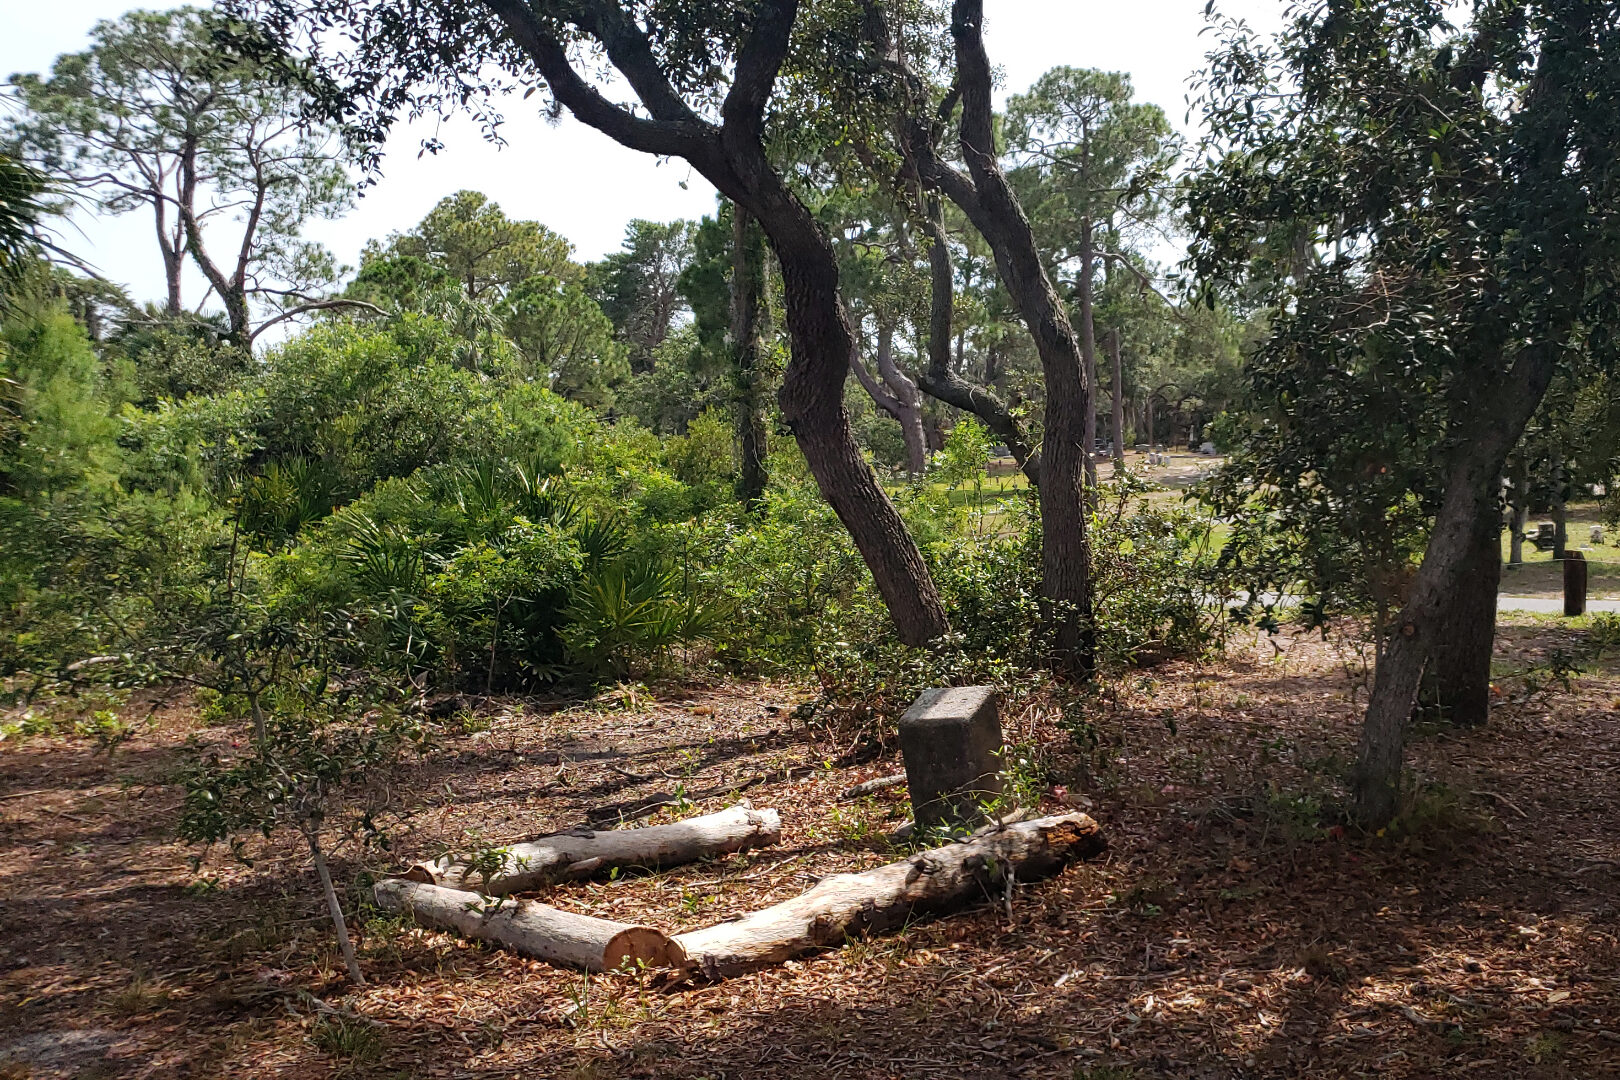
– Images of Sandy’s Damage in Monmouth County –

A treefall in our apartment complex.

Another treefall laying across electric wires behind our neighbor’s building.

A view of Monmouth University’s campus. This photo was taken Tuesday (10-30) morning. Crews were already cleaning up the downed trees, campus will look very different when we return in the coming days.
My Maps of Hurricane Sandy

Wednesday Update: we woke up to power and sunny skies (which are clouding up again). My wife and I spent the last day or so cooking meals on a camping stove (outside, of course) and checked on friends (and their homes). Here is my last map of Hurricane Sandy, or post tropical cyclone Sandy, which is still moving around the Northeast. Thankfully, the worst appears to be over.
– Lost power at 8:30m Monday (10-29) –

Here is a map of the current Real-Time Mesoscale Analysis (RTMA) surface wind velocities. We are really feeling them now. The actual time for this image is sometime between 15:00 and 16:00pm EST.

A map of the predicted rainfall levels for the next 12 hours as Sandy makes landfall.
(greens are 3 inches or less, reds are 8+ inches)

Map showing sustained wind speeds for the Jersey Shore and NYC.

Here is the same view as the image below with the current cloud cover. A large storm, to be sure. The image shows visible clouds, it is not infrared or rainfall.

Sandy is now predicted to make landfall just south of Atlantic City. The dark blue line shows updated track info as of Monday morning, light blue line was predicted track as of Sunday afternoon.

For a better understanding of Sandy’s size and reach, here is a picture from NOAA’s GOES-13 satellite at approximately 9am Sunday October 28 (today)

A quick map of Hurricane Sandy as of Sunday afternoon (10-28-2012)